


As we reach the halfway point of 2026, the first half of the year has continued to surprise investors.
Geopolitical tensions persist, with limited resolution surrounding Iran, Israel, and the US, and restricted shipping through the Strait of Hormuz continuing to weigh on oil and export flows. At home, Keir Starmer’s resignation has triggered yet another UK leadership contest.
Despite these headwinds, equity markets have continued to generate double-digit returns, with emerging markets, particularly South Korea, recording notable growth opportunities, while bond markets have delivered steadier but more muted performance.
What does another UK leadership contest mean for investors?
On 22 June, Keir Starmer announced his resignation from 10 Downing Street, leaving investors with a new set of questions to consider in the coming months.
At the time of writing, (early July) Andy Burnham is the only person to announce their candidacy for prime minister, meaning he is currently expected to be sworn in on 17 July. This resignation continues a period of high political instability, and when the Labour Party elects its next leader, the UK will have officially had its seventh prime minister in just 10 years. While markets tend to react poorly to uncertainty, they appear at present to be pricing in the likelihood of a Burnham government, and there are some key considerations for investors to weigh.
Political instability tends to play out first in bond and currency markets. Markets appear to have priced in a Burnham victory, and the 10-year gilt yield initially rose before settling on the day of Starmer’s resignation.
While this highlights a relatively muted response from bond market investors, it is a level which already sits higher than that of any other developed nation.
Burnham has promised to maintain the fiscal rules set out by Rachel Reeves, which markets may view as a positive signal for gilts. UK borrowing costs have risen consistently since the July 2024 general election, as shown by the 10-year gilt yield. This peaked on 15 May at its highest rate since the 2008 financial crisis, reflecting both speculation over Burnham’s leadership challenge and continued global uncertainty around long-term energy prices.
Currency and equity markets have also had time to react. Sterling weakened against the dollar as pressure mounted on Starmer to resign but remained relatively flat on the day of the announcement itself. The FTSE 100 rose 0.4%, and the FTSE 250 settled slightly lower at -0.3%, a muted response consistent with the resignation being widely anticipated and the global nature of the UK equity market. One area investors are likely to watch is how gilt markets respond once a new chancellor is announced, as this could provide an indication of the new government’s fiscal direction. A globally diversified portfolio and a long-term investment mindset may prove particularly valuable over the coming months.
What lessons can we learn from the SpaceX IPO?
There has been a lot of fanfare surrounding the recent SpaceX IPO, as well as the upcoming Anthropic, OpenAI, and SK Hynix IPOs, which are likely to follow this year. These upcoming mega-IPOs are riding on whatever momentum SpaceX manages to muster, making it an especially important offering. SpaceX has experienced a volatile opening few weeks; however, to what extent was this to be expected?
Since its initial offering, the stock price for SpaceX has been subject to much scrutiny for its volatility. When it began trading on 12 June, the stock hit highs of $211 before settling at $156 on 23 June. While these swings equate to an eyewatering annualised volatility of c.205%, it seems much more dramatic than reality when looking at the journey of the share price visually. This statistic is based on such a short time basis, making the sample size hard to generalise. Another important caveat is that, according to CNBC, the SpaceX IPO had “unprecedented” demand across a number of retail investor platforms.
While many platforms have policies on selling IPOs within a certain timeframe, this did not stop several retail investors from selling their stakes early on. Exposing retail investors to an IPO that has had unparalleled media coverage is likely to cause volatility in the share price.
In truth, it’s almost impossible to know this early on whether the trajectory of the share price is justified or not. IPOs often underperform over the shorter term, and current concerns and market sell-offs regarding anything AI-related are exacerbating the volatility of the stock. So, while this is a record-breaking IPO, it appears to be following the typical script of company initial offerings.
Investors in broad, market-capitalisation-weighted index funds are also likely to gain exposure over time. Morningstar estimates SpaceX will enter Vanguard’s Total Stock Market ETF at less than 0.2% of the fund, illustrating how broad market indices naturally incorporate new companies as they become eligible.
What is happening in the Korean markets?
While some may try to convince you otherwise, global equity market capitalisation is anything but static. South Korea is now the world’s sixth largest stock market, having leapfrogged both India and the UK earlier this year. Strong regional performance has come alongside high volatility, making it both a source of capital appreciation and increased risk in 2026.
AI is the lynchpin behind Korea’s rise. While the US focuses on infrastructure, data centres, and the machine learning models themselves, Korea underpins the hardware, benefiting from a super cycle in demand for semiconductor memory chips, with Samsung and SK Hynix the two companies meeting this demand.
The US has often been criticised for its “Magnificent Seven” concentration, yet this pales beside the KOSPI: its top five stocks account for 52% of the index, compared to around a quarter for the S&P 500. Market concentration often raises the question of systemic risk in the current markets; however, this is not a new phenomenon. In 1965, the S&P 500 had similar top 10 concentration to today (according to Asset TV), when Kodak, General Motors, and AT&T dominated. Despite those companies subsequently underperforming, the index still delivered cumulative returns of around 110% through the 1960s. This period highlights that concentration does not necessarily impede broader index performance.
The KOSPI has returned 97% year-to-date, but this has been far from a smooth journey, with market drops seen throughout the quarter. In late June, the market dropped by almost 10%, reflecting investor fear of the AI boom globally, which appeared to affect Korea disproportionately. Samsung and SK Hynix tumbled 12% in the sell-off, which dragged the rest of the market’s performance down in tandem. While this is a highly concentrated market by any measure and that comes with its own risks, there are also risks to long-term performance from excluding regions or companies from a portfolio. No one knows who the next winners will be, so diversification and broad market exposure may help mitigate some of the risks associated with both concentration and under-diversification.
Asset class returns
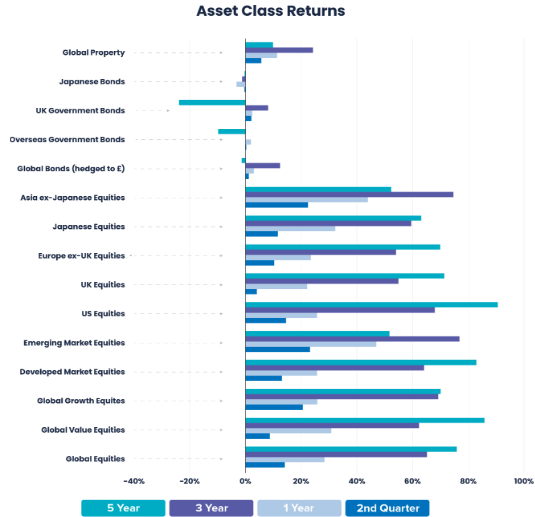
© Timeline Holdings Ltd 2026. Data as of 30/06/2026. Source: Morningstar (provided without liability). Based on Daily Total Returns (net of all fund charges). Excludes taxes and inflation which reduce actual returns. Performance periods: 1st Quarter: 01/04/2026 – 30/06/2026, 1 Year: 01/07/2025 – 30/06/2026, 3 Year: 01/07/2023 – 30/06/2026, 5 Year: 01/07/2021 – 30/06/2026.
Proxies: Asia ex-Japanese Equities: Morningstar Asia Pacific ex-Japan Large-Mid Cap GR GBP; Developed Market Equities: Developed Market Equities: Morningstar Developed Markets Target Market Exposure GR GBP; Emerging Market Equities: Emerging Market Equities: Morningstar Emerging Markets Target Market Exposure GR GBP; Europe ex-UK Equities: Europe ex UK Equities: Morningstar Developed Europe Target Market Exposure GR GBP; Global Bonds: Global Bonds: Vanguard Global Bond Index Hedged Acc GBP in GB; Global Corporate Bonds (hedged
£): Vanguard Global Bond Index Hedged Acc GBP in GB: Global Equities: Global Equities: Morningstar Global Markets GR GBP; Global Growth Equities: Global Growth Equities: Morningstar Global Growth Target Market Exposure GR GBP; Global Property: Global Property: Morningstar Global Real Estate GR GBP; Global Value Equities: Global Value Equities: Morningstar Global Value Target Market Exposure GR GBP; Japanese Bonds: Japanese Bonds: Morningstar Japan Treasury Bond TR GBP Hedged; Japanese Equities: Japanese Equities: Morningstar Japan GR GBP; Overseas Government Bonds: Overseas Government Bonds: iShares Overseas Government Bond Index (UK) D Acc in GB; UK Equities: UK Equities: Morningstar UK GR GBP; UK Government Bonds: Vanguard UK Government Bond Index Acc GBP in GB; US Equities: US Equities: Morningstar US Target Market Exposure TR GBP. Past performance is not a reliable indicator of future results.
Equity: AI momentum, policy noise, and a broader global rally
Global equity markets delivered positive returns during the second quarter, despite bouts of volatility driven by resilient economic data, strong corporate earnings, and continued AI investment. Several major indices, including the S&P 500 and Nasdaq Composite, reached new record highs according to Reuters. Easing concerns over Middle East energy supply disruptions provided further support, though gains moderated towards quarter-end as investors reassessed the inflation and interest rate outlook.

© Timeline Holdings Ltd 2026. Data as of 30/06/2026. Source: Morningstar (provided without liability). Gross Total Returns shown in GBP. Index returns do not account for fees. Quarterly data should not be viewed in isolation. Past performance is not a reliable indicator of future results.
US equities rebounded strongly, with the S&P 500 and Nasdaq reaching new record highs as investors refocused on AI and technology-led growth. Continued investment in data centres and cloud infrastructure benefited large technology companies, complemented by strong corporate earnings. While the market experienced a period of volatility as investors reassessed the sustainability of the technology rally, broader sentiment remained resilient. The US dollar weakened initially as energy prices eased and risk sentiment improved, but recovered towards quarter-end as the Federal Reserve maintained a hawkish stance. As a result, currency effects were less pronounced than might have been expected, with the strong performance of US equities remaining a driver of returns in portfolios.
European equities delivered strong returns during the quarter, gaining 10.27% in GBP terms. After a volatile start to the period, sentiment improved as energy prices eased and concerns over further geopolitical escalation moderated. Economic activity remained relatively resilient despite weaker services activity. Performance was supported by a broad range of sectors; however, the region’s more limited exposure to AI-related technology meant it benefited less from the technology-driven rally than other markets. Financials remained resilient, supported by strong earnings and capital positions, while industrials benefited from ongoing investment in defence, infrastructure, and manufacturing.
UK equities delivered modestly positive returns during the quarter but lagged other major regions. Banks, energy, and mining companies provided support at various points during the quarter, while investors continued to favour established businesses with resilient cash flows, dividends, and share buyback capacity. The market’s defensive and value-oriented composition, together with the international exposure of many larger UK companies, provided some resilience during periods of uncertainty. Returns were uneven as Middle East tensions and changing expectations for Bank of England policy affected sentiment.
Meanwhile, the UK’s limited exposure to large technology, semiconductor, and AI-related companies meant it captured less of the rally that supported US and Asian markets.
Emerging market equities were the strongest-performing major region, supported by improving investor sentiment, a weaker US dollar, and strong demand for technology and semiconductor companies in Asia. Taiwan and South Korea were clear standouts, with Korea’s semiconductor exports rising 169.4% year-on-year in May, though their high technology exposure also made them more sensitive to sector volatility. China and India contributed mixed returns, with domestic growth concerns in China and higher energy prices in India.

© Timeline Holdings Ltd 2026. Data as of 30/06//2026. Source: Morningstar (provided without liability). Gross Total Returns shown in GBP. Index returns do not account for fees. Quarterly data should not be viewed in isolation. Past performance is not a reliable indicator of future results.
The AI-driven rally continued to shape equity market performance during the quarter, creating a clear gap between growth, small-cap, and value stocks. Growth stocks were the strongest-performing style, supported by substantial investment in AI infrastructure. Smaller companies and value stocks also delivered positive returns, although both lagged the strong performance of growth. Small caps rose ahead of value stocks, with small-cap performance reflecting selective opportunities across technology, industrial, and energy businesses.
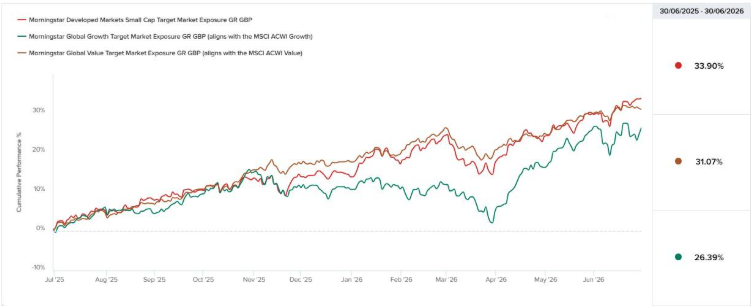
© Timeline Holdings Ltd 2026. Data as of 30/06/2026. Source: Morningstar (provided without liability). Gross Total Returns shown in GBP. Index returns do not account for fees. Quarterly data should not be viewed in isolation. Past performance is not a reliable indicator of future results.
While small-cap and value stocks lagged growth during the quarter, both factors delivered strong absolute returns over the past year.
Fixed income – Higher yields and renewed inflation concerns
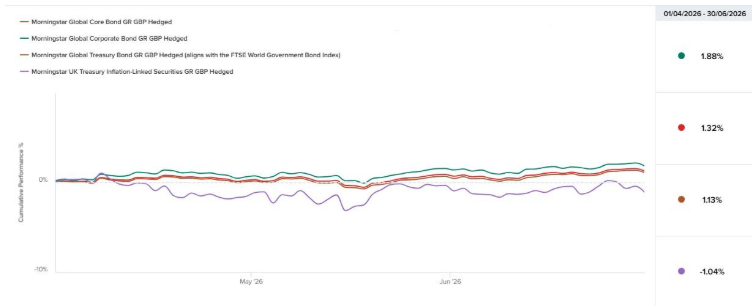
© Timeline Holdings Ltd 2026. Data as of 30/06/2026. Source: Morningstar (provided without liability). Gross Total Returns shown in GBP. Index returns do not account for fees. Quarterly data should not be viewed in isolation. Past performance is not a reliable indicator of future results.
Fixed income markets experienced a challenging and volatile quarter. Rising energy prices and Middle East tensions increased uncertainty around inflation and interest rates, with longer-dated government bond yields reaching multi-decade highs in several developed markets. Investors demanded greater compensation for persistent inflation risks, higher expected government borrowing, and fiscal uncertainty.
The US experienced a challenging and volatile environment for government bonds. Investors steadily reduced expectations for near-term interest rate cuts as the economy remained resilient despite higher energy prices and persistent inflation concerns. The Federal Reserve kept its policy rate unchanged in June, while signalling a cautious approach as inflation remained above target. Treasury yields increased at points during the quarter as investors adjusted to the possibility that interest rates could remain higher for longer. Persistent inflation concerns, resilient economic data, and higher expected government borrowing added pressure to longer-dated Treasury yields.
Across Europe, sovereign bond markets were influenced by changing inflation expectations and developments in energy markets. The European Central Bank raised interest rates by 25 basis points in June, taking the deposit rate to 2.25%, as inflation and energy prices moved higher. Sovereign bond yields generally rose during much of the period, reflecting concerns around inflation and government borrowing. Over the period, inflation concerns fell, and expectations for further ECB tightening were scaled back, supporting government bond markets and pushing Germany’s 10-year Bund yield down towards 2.9% (according to Trading Economics), its lowest level since March.
UK gilt markets remained volatile throughout much of the quarter as investors weighed concerns around government borrowing, fiscal sustainability, and the inflation outlook. Lower-than-expected inflation data and falling oil prices initially supported government bond markets and reduced expectations of further interest rate increases. However, the Bank of England kept the base rate unchanged at 3.75% and continued to highlight inflation risks, leading yields to rise following the policy announcement.
Emerging market debt delivered mixed returns during the second quarter of 2026, with performance shaped by higher oil prices, changing US interest rate expectations, and currency movements. The International Monetary Fund noted that bond spreads generally widened more for oil importers than for oil exporters during the energy shock. Despite the energy pressures, emerging market debt continued to provide relatively high income, supported by positive real yields and improved policy credibility in several countries.
However, returns remained highly dependent on country selection, the direction of US Treasury yields, and currency movements.
Performance commentary
Timeline Multi-Asset Fund Range
The TM Timeline funds have broadly mirrored global market performance over the period, consistent with their passive and market-aligned approach. The TM Timeline 100% Equity Fund returned 15.04% in Q2 26, compared with 14.16% for global equities.
Emerging markets were the strongest-performing region, with support from both the US and Europe helping to bolster returns. The fund’s market-capitalisation-weighted approach meant that its larger holdings in mega-cap technology businesses benefited as growth stocks led the market. Currency effects were limited, as the US dollar’s initial weakness reversed towards quarter-end. Overall, performance was consistent with the fund’s passive approach and broadly in line with the comparable Tracker MPS.
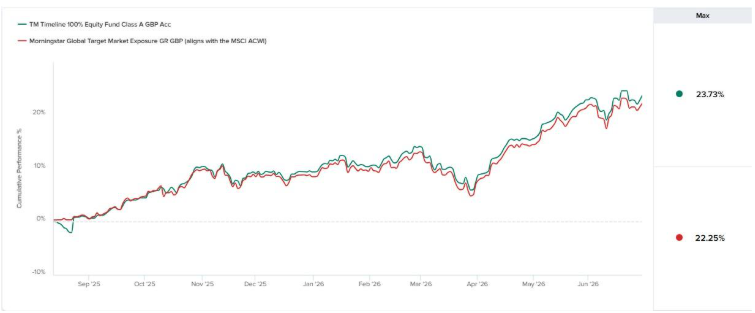
© Timeline Holdings Ltd 2026. Data as of 30/06/2026. Source: Morningstar (provided without liability). Based on Daily Total Returns (net of all fund charges). Excludes taxes and inflation which reduce actual returns. Past performance is not a reliable indicator of future results.
Important: These funds have been trading for less than a year (launched 12 August 2025); therefore, performance data is limited and does not provide a complete picture of how they may perform across different market conditions. This is provided for adviser use only to monitor fund progress and must not be shared with retail clients or viewed in isolation. Refer to the full Prospectus and KIID before assessing suitability.
Timeline Tracker
The Tracker 100 returned 15.14%, benefiting from its full exposure to global equities. While emerging markets were the strongest-performing regional allocation, North America made the largest contribution to overall returns because of its substantially higher weight in the market capitalisation-weighted portfolio. Large technology companies benefited from continued investment in AI, while emerging markets also added positively, supported by strong performance from Asian technology and semiconductor companies. European holdings added support through financials and industrials. The portfolio’s market-capitalisation-weighted approach meant it participated in the strength of large-cap growth businesses, which led equity market returns during the quarter.
The Tracker 0 returned 1.49%, reflecting the more modest fixed income backdrop. Its diversified allocation across UK and global government bonds, shorter-dated bonds, investment-grade corporate bonds, and inflation-linked gilts provided broad exposure. Corporate bonds remained relatively resilient, providing support from coupon income, although rising government bond yields constrained overall returns.
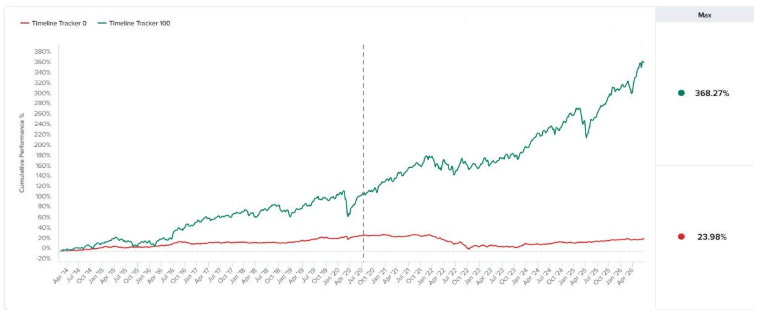
© Timeline Holdings Ltd 2026. Data as of 30/06/2026. Source: Morningstar (provided without liability). Based on Daily Total Returns (net of all fund charges and our standard DFM fee). Excludes taxes and inflation which reduce actual returns. MPS launched on 15/07/2020. Pre-2020 back tests the funds held at launch to the inception date of the newest fund. Our 10% drift-tolerance rebalancing methodology applies throughout. This includes simulated data and does not represent actual client returns. Past performance (actual or simulated) is not a reliable indicator of future results.
Timeline Classic
The Classic 100 returned 11.94%, benefiting from the broader global equity rally, including strong emerging-market performance and positive contributions from financials and technology. Although value and smaller companies delivered positive returns, they lagged growth stocks, which benefited most from the strong performance of large technology companies during the quarter.
The Classic 0 returned 0.57%, which has an allocation to global bonds, inflation-linked bonds, and shorter-dated bonds, providing diversification. However, rising government bond yields, driven by inflation concerns and changing interest-rate expectations, constrained returns.
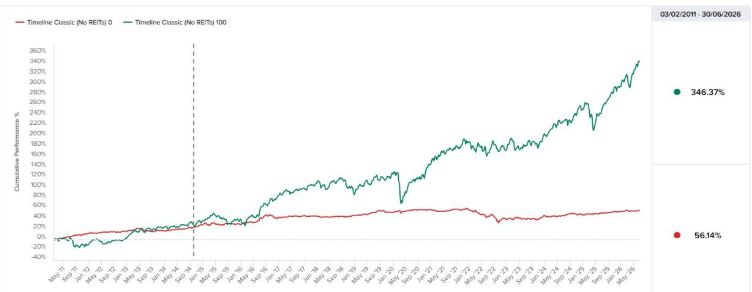
© Timeline Holdings Ltd 2026. Data as of 30/06/2026. Source: Morningstar (provided without liability). Based on Daily Total Returns (net of all fund charges and our standard DFM fee). Excludes taxes and inflation, which reduce actual returns. It includes the current discretionary management (Dec 2020 – present) and the period it was managed as an advisory model (Oct 2014 – Dec 2020). Pre-2014 back tests the funds held at launch to the inception date of the newest fund. Our 10% drift-tolerance rebalancing methodology applies throughout.
This tracks the model’s history and includes simulated data; it does not represent actual client returns. Past performance (actual or simulated) is not a reliable indicator of future results.
Timeline ESG Tracker
The ESG Tracker 100 portfolio returned approximately 16.01% over the period. The portfolio benefited from the strong performance of large technology companies, supported by continued investment in AI. While emerging markets were among the strongest-performing regional allocations, North America made the largest contribution to overall returns because of its substantially higher weight in the market capitalisation-weighted portfolio. The ESG focus of the portfolio resulted in lower exposure to traditional energy companies. Energy shares were volatile during the quarter, receiving temporary support from higher oil prices before easing as concerns around supply disruption receded. This lower exposure to traditional energy provided a modest benefit over the period.
The ESG Tracker 0 portfolio returned approximately 1.49% over the period. The portfolio’s diversified bond allocation provided some support through resilient corporate bond performance and income, although rising government bond yields limited overall returns.
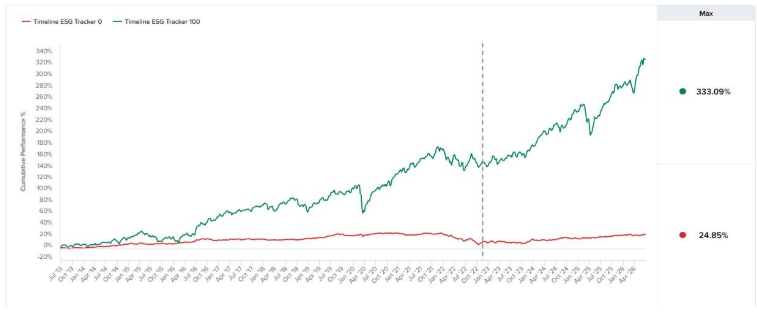
© Timeline Holdings Ltd 2026. Data as of 30/06/2026. Source: Morningstar (provided without liability). Based on Daily Total Returns (net of all fund charges and our standard DFM fee). Excludes taxes and inflation which reduce actual returns. MPS launched on 16/11/2022. Pre-2022 back tests the funds held at launch to the inception date of the newest fund. Our 10% drift-tolerance rebalancing methodology applies throughout.
This includes simulated data and does not represent actual client returns. Past performance (actual or simulated) is not a reliable indicator of future results.
Timeline ESG Classic
The ESG Classic 100 portfolio returned approximately 16.13% over the period. The portfolio benefited from the strength of global equity markets, particularly technology and semiconductor companies, as well as emerging market holdings. However, its value and smaller-company tilts captured less of the gains from the largest growth companies. ESG screening resulted in lower exposure to traditional energy companies, which was a modest benefit as energy shares were volatile in the period.
The more defensive ESG Classic 0 portfolio returned approximately 0.82% over the period. Rising government bond yields, particularly UK gilts, constrained returns. However, income from its predominantly investment-grade bond holdings, together with inflation-linked and shorter-dated bonds, provided some support.

© Timeline Holdings Ltd 2026. Data as of 30/06/2026. Source: Morningstar (provided without liability). Based on Daily Total Returns (net of all fund charges and our standard DFM fee). Excludes taxes and inflation which reduce actual returns. It includes the current discretionary management (Dec 2020 – present) and the period it was managed as an advisory model (Nov 2016 – Dec 2020). Pre-2016 back tests the funds held at launch to the inception date of the newest fund. Our 10% drift-tolerance rebalancing methodology applies throughout.
This tracks the model’s history and includes simulated data; it does not represent actual client returns. Past performance (actual or simulated) is not a reliable indicator of future results.
Closing thoughts
Over the past quarter, the same key themes have continued to influence portfolio returns for clients. AI has both been a positive contributor and detractor from global markets. Tension in the Middle East is still persistent, leaving global bond markets and central banks cautious for future moves. The UK is likely to have some transition in leadership in mid-July, which will likely frame future policies and the Autumn Budget depending on what future route Burnham and his chancellor decide to take with fiscal policy. Finally, mega-IPOs are likely to be key themes throughout the year, with Anthropic and OpenAI both potentially listing this year.
Despite all this uncertainty, equity markets have continued to move from strength to strength. At the midpoint of the year, equity markets are currently on course for another year of double-digit returns, although future performance cannot be predicted. With a lot still to come this year, what will happen next remains uncertain. As investors, it’s always important to remain focused on your financial plan and ignore the potential noise that can occur from the wider economic landscape.
Please note:
Performance data for Timeline Model Portfolio Services (MPS) and Timeline Multi-Asset Funds are calculated based on the following:
- Model history (MPS only): This includes the current period the model has been managed on a discretionary basis as a Model Portfolio Service (MPS) and, where relevant, any period when the model was managed as a strategy for advisers to implement (“Advisory Model”). The launch date used is based on the start of the model history, including any period where it operated as an advisory model.
- Simulated data (MPS only): Prior to the model launch date, simulated data is used to show the hypothetical performance of the funds held at launch date back to the inception date of the newest fund.
- Total returns: Based on daily total returns with all income reinvested unless otherwise stated.
- Net Asset Value (NAV): We show the return after fund charges.
- Includes: Our standard discretionary management fee (0.09%) for MPS returns.
- Excludes: Taxes and the effect of inflation, and any additional fees an investor may pay, such as platform or advice fees – all of which can reduce actual returns.
- Currency: All returns are shown in GBP currency.
- Rebalancing (MPS only): Our rebalancing methodology applies throughout and resets the model whenever the equity or fixed income exposure drifts 10% or more away from its original target asset allocation.
Individual returns will vary based on the specific model entry date. Entry into the model starts at the target asset allocation rather than its current drifted position, with the rebalancing methodology applied from that point forward.
Past performance (actual or simulated) is not a reliable indicator of future results. The value of investments and the income from them can go down as well as up and you may get back less than you invest. Individual returns will vary.

 Production