


There are certain periods where the conviction in our investment philosophy is affirmed even more strongly than usual. This most recent quarter is one. The first three months of 2026 have highlighted the fact that no one can predict what will happen in the markets.
In truth, it has been difficult to write this quarter’s commentary. First and foremost, from a human perspective, our thoughts are with those impacted by these events. Secondly, the speed and unpredictability of all the events unfolding in Iran and the Middle East have meant that information can quickly become outdated, even in a matter of hours. To try to avoid the immediate obsolescence of this report, Timeline has aimed to focus on the wider and more developed themes and potential repercussions of the evolving situation in Iran.
Over a ($100) Barrel
“Unprecedented” seems to be the only word that can fully encapsulate what is currently happening in the global oil market. As of writing, the BBC reports that oil sits just below $100 a barrel, having been sitting at roughly $113 at the beginning of the day. As with most markets, these price swings ultimately boil down to uncertainty.
Again, at the risk of obsolescence, the situation surrounding the Strait of Hormuz and any potential reopening remains uncertain. This small waterway transports roughly a fifth of global oil and liquefied natural gas annually, meaning disruption has a major impact on global supply chains. This spreads beyond the energy sector; oil and its derivatives are integrated deeply into our everyday lives. Oil-based products are involved in everything from toothbrushes to bike tyres, making ending the standstill in the Strait a global priority. In particular, for those countries in Asia, which make up roughly 80% of the demand for oil that passes through the Strait of Hormuz.

Source: IEA (2026)
The strain of the escalating tension is already beginning to hit Asian markets, with high-yield dollar bonds bearing the brunt of investor apprehension. The repercussions of the war have already created signs of pressure in daily life in Asia. Vietnam has encouraged citizens to remain at home, and Sri Lanka has declared every Wednesday a holiday for public institutions to conserve fuel. Whilst the energy shock will be felt globally, as every Asian country is a net importer of fuel, they may be disproportionately hit with the brunt of the oil and natural gas price increases. It’s likely that interest rate hikes will be needed to tackle subsequent inflation, so the full impact may trickle through to bond and equity markets of the region later this year.
Trump has reached a difficult precipice, and he will be looking to avoid prolonged conflict that would steepen energy prices further. Without a clearly defined resolution to the war in sight, investors are concerned that the damage is already done, even if a swift resolution is suddenly achieved. The war has significantly disrupted critical energy infrastructure, with dozens of refineries, oil fields and gas plants hit by missile or drone strikes. This means even if a resolution is reached, there will be considerable time before production can be restored to pre-war levels. Oil prices may be elevated for an extended period.
A potential good news story may emerge from the crisis, however, as the world looks for ways to avoid this scenario in future. The solution may be a meaningful move towards green energy. The value of this is clear to see in Europe. While most of the continent scrambles to protect its citizens from energy rises, Spain has been largely spared, having levelled up its wind and solar power infrastructure in 2019, according to Euronews, reducing the influence of expensive fossil generators on the electricity price by 75%. The situation in the Middle East, overlapping with the existing conflict in Ukraine, means governments are looking at how to protect their economies from international oil and gas shock
(Not so) Safe Haven Assets
There is normally a simple pattern that emerges in times of geopolitical uncertainty that is reassuringly predictable. Investors will tend to ‘derisk’ their portfolios and move into more traditionally ‘safe haven’ assets, including UK gilts, US T-bills, gold, and currencies like the US dollar and the Swiss franc. This can lead to these assets retaining, or even gaining, value in periods of market turbulence. However, this quarter seems to have caused a glitch in normal investor behaviour, and many of these assets have not benefited from this traditional flight to safety. There are a few reasons why this may not be the case in this current climate.
The drop in value of the original safe-haven asset, gold, could be particularly perplexing to investors. While this type of volatility in a safe haven asset may make some clutch their pearls, in reality, it is behaving in a similar way to previous black swan events like the Russian invasion of Ukraine in 2022. There are several reasons that this is the case. Firstly, investors have aimed to capitalise on the record highs of the asset class by taking some profits. Secondly, with central banks likely to increase rates this year, gold can become less attractive as an asset, as it doesn’t pay any interest to investors. Finally, liquidity requirements can sometimes outweigh the demand for a safe haven. Gold is often popular in times of crisis, but it’s important to remember that it is not infallible; like all assets, it comes with its own set of quirky behaviours.
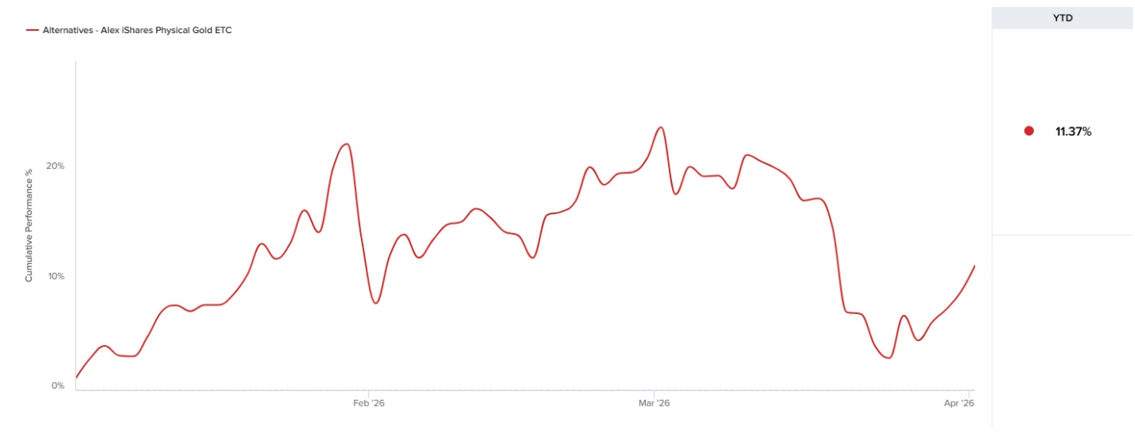
© Timeline Holdings Ltd 2026. Data as of 31/03/2026. Source: Morningstar (provided without liability). Based on Daily Total Returns (net of all fund charges). Excludes taxes and inflation, which reduce actual returns. Exchange Traded Commodity (iShares Physical Gold ETC) is used as a proxy for the gold price. Quarterly data should not be viewed in isolation. Past performance is not a reliable indicator of future results.
In times of market turmoil, like the Global Financial Crisis, the US dollar can often increase in strength compared to other global currencies. There are several reasons this is the case, including: liquidity, the dollar is the most widely used currency in global trade; and it is a reserve currency, meaning it’s often held by many international central banks. While there was a strong rally at the outbreak of the conflict, the dollar began to slip against other major currencies towards the end of March. Analysts at Goldman Sachs have reported potential further issues for the dollar once the conflict begins to settle, as economies turn their attention towards the impact the war has had on growth. With the continued stalemate in the Strait of Hormuz, international fears of potential stagnant growth may continue to mute the dollar’s performance this year.
Gold and the dollar have something in common: they can both be physically owned. In 2024, Wells Fargo estimated that Costco sold as much as $200 million in gold bars monthly, and a 2025 study (reported by Yahoo Finance) found that 6% of Americans keep physical cash under their mattress at home. Both these statistics are staggering and highlight the behavioural bias for investors in potential times of stress, which can be detrimental to long-term planning goals. It can be hard to go against instinct in times of uncertainty, but sometimes these behaviours can have long-term impacts on financial outcomes.
Central Bank Repercussions
While many countries have stayed out of direct conflict, there will be collateral damage globally. Rising prices will prompt central banks to review monetary policies, in particular interest rates, to help economies shoulder the financial burdens. The first wave of central bank decisions came in mid-March, with the US, UK and Europe all announcing. So, what did some of the finest minds in finance signal with their decisions to collectively hold rates? Perhaps that no one, really, knows what is going on, and what kind of escalation may happen over the coming weeks.
The major question that is probably at the top of central banks’ docket is whether they can ignore the inflation implications of an energy supply shock, or whether they need to take action on this. An energy supply shock is difficult to manage; it’s not like certain monetary shocks, where tools like quantitative easing/tightening can be used. Unfortunately, we can’t just ‘print’ more oil as a solution to this problem. There are some strategic reserves that can be released, but in theory, these may also run dry. Will this be a sustained, meaningful shift in inflation, or simply a one-off spike that is resolved with a ceasefire?
There had been pressure on some central banks to cut interest rates recently. Trump is pressuring Powell in the US, and bond markets in the UK are signalling their thoughts on the rate hold as well. If we take a minute to focus on the UK, the impact of the Iran war on gilts may not have been the traditional flight to safety we have come to expect. The unanimous decision to hold rates was somewhat unexpected, but the markets were jittery in response to the dropping of previous guidance, which pointed to future reductions in interest rates. This decision triggered an aggressive sell-off of short-dated gilts, in particular the two-year gilts.
Two-year gilts tend to be a proxy for investors on what they think will happen in UK interest rates in the coming months. There has been a shift in sentiment – previously, a rate cut was priced in as imminent, now there’s a belief there is likely to be a rate rise before the end of the year. The drop in price has, in turn, pushed up yields, causing an increase in government borrowing costs. This can signal investor discontent, and increases on two-year gilts were a strong indication that markets are wary of the UK’s interest rate environment this year. You can see the knock-on impact of these changes in price in the short-dated UK government bond market below:
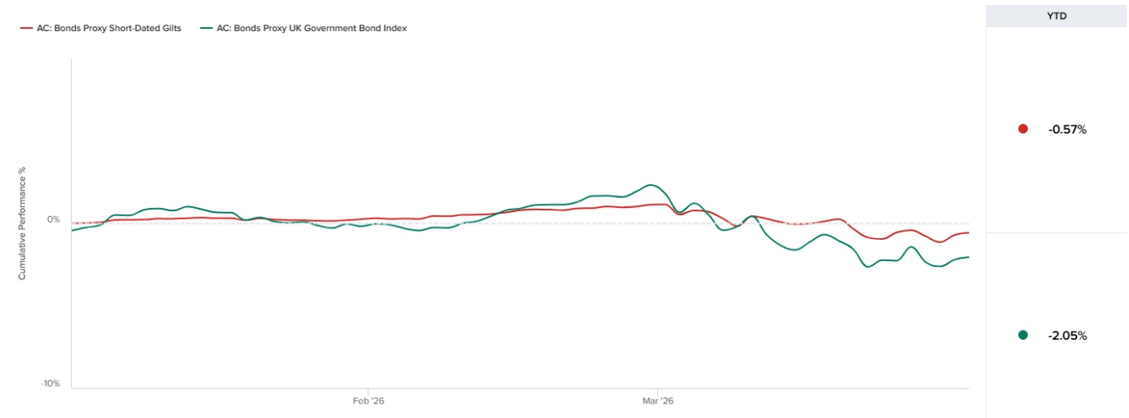
© Timeline Holdings Ltd 2026. Data as of 31/03/2026. Source: Morningstar (provided without liability). Based on Daily Total Returns (net of all fund charges). Excludes taxes and inflation, which reduce actual returns. The Royal London Short Duration Gilt Fund and Vanguard UK Government Bond Index Fund are used as a proxy for the asset. Quarterly data should not be viewed in isolation. Past performance is not a reliable indicator of future results.
Rates could go up to try to curb inflation increases, or they could go down if central banks fear a recession may be on the horizon. One thing is clear: no one, including central banks and politicians (even asset managers!), knows what will happen. Markets do not thrive in uncertainty, and so these conditions are leaving investors jumpy. Until we have any clear indication of the way forward, there is likely to be short-term volatility. Timeline’s philosophy will remain the same, focusing on the long-term plan, behavioural coaching and staying calm is usually the best course of action in these uncertain times.
The Public Woes of Private Credit
It can understandably be hard to take a step back from all that is happening in Iran to consider other events that have happened this quarter. There are themes emerging in other areas of the market that have also attracted some interest in the headlines. Private credit can be seen as murky waters, but with some investors taking an interest in claims of lower volatility, higher yields and enhanced portfolio diversification, it has started to entice further interest. Recent news has drawn attention to the riskier side of private credit, with some worried about the knock-on effect of this market on the global financial system and others calling it a storm in a teacup. In brief, we wanted to touch on the reasons and rationale behind the recent headlines before diving into our detailed asset class returns for the quarter.
Private credit became particularly popular after the global financial crisis; many companies needed financing but looked a bit too risky for traditional bank loans. Once a relatively niche part of the markets, the asset class has now grown to a roughly $2 trillion beast. Industry experts are torn over whether this booming market is a blessing or a curse. On the one hand, it has helped move riskier debt away from banks and into funds managed by experts in the area. This gives some people peace of mind; if the fund takes a hit, it shouldn’t put the traditional everyday depositors’ accounts in danger. This sounds great in theory, but some are concerned that this loosely regulated area of the market might be too eager to give out loans. These deals often have little transparency, and some more traditional banks are trying to venture into this area.
At the end of March, two of the largest names in the private credit space, Apollo Global Management and Ares Management Corp, fuelled headlines by limiting investors from withdrawing their funds, signalling a strain in the market. The increase across the board in redemption requests signals that investors are perhaps nervous about the liquidity of the notoriously illiquid asset class. Bloomberg reports that a similar strain is coming from investor inflows, showing a weaker demand for the assets.
What does this mean for private credit? As with most things investment-related, no one can predict. There’s naturally trepidation over the circumstances, with some reports fearing that conditions are starting to mirror those we saw in 2007. With AI expansion and adoption increasing, the need for data centres is booming. This key infrastructure is increasingly funded by private debt, and investors are cautious that a bubble may be appearing. This, teamed with potentially higher interest rates in the future and increased volatility in the markets due to the war in Iran, means there could be the potential for higher default rates in the future. Is this a problem for the everyday consumer? Most likely not directly, but if there are too many defaults, then potentially. The bulk of assets for private credit comes from institutional investors who have long investment time horizons. These institutions are more able to weather volatility, and perhaps enjoy the premium that comes from the asset class’s illiquidity. While no market is an ‘island’ and issues would likely spill over into the traditional markets, the extent to which this would happen isn’t truly known.
Asset Class Returns
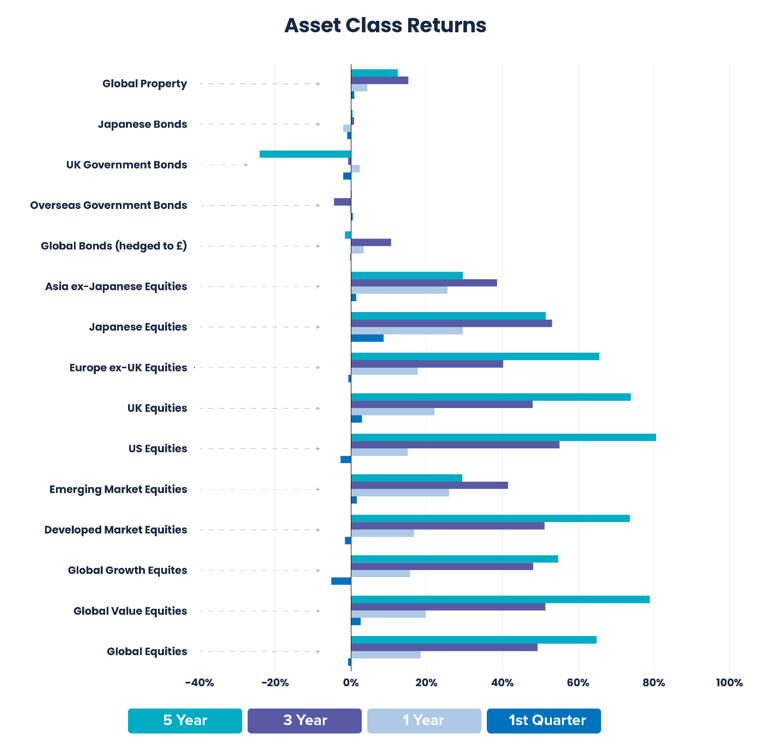
© Timeline Holdings Ltd 2026. Data as of 31/03/2026. Source: Morningstar (provided without liability). Based on Daily Total Returns (net of all fund charges). Excludes taxes and inflation, which reduce actual returns. Performance periods: 1st Quarter: 01/01/2026 – 31/03/2026, 1 Year: 01/04/2025 – 31/03/2026, 3 Year: 01/04/2023 – 31/03/2026, 5 Year: 01/04/2021 – 31/03/2026.
Proxies: Asia ex-Japanese Equities: Morningstar Asia Pacific ex-Japan Large-Mid Cap GR GBP; Developed Market Equities: Developed Market Equities: Morningstar Developed Markets Target Market Exposure GR GBP; Emerging Market Equities: Emerging Market Equities: Morningstar Emerging Markets Target Market Exposure GR GBP; Europe ex-UK Equities: Europe ex UK Equities: Morningstar Developed Europe Target Market Exposure GR GBP; Global Bonds: Global Bonds: Vanguard Global Bond Index Hedged Acc GBP in GB; Global Corporate Bonds (hedged £): Vanguard Global Bond Index Hedged Acc GBP in GB: Global Equities: Global Equities: Morningstar Global Markets GR GBP; Global Growth Equities: Global Growth Equities: Morningstar Global Growth Target Market Exposure GR GBP; Global Property: Global Property: Morningstar Global Real Estate GR GBP; Global Value Equities: Global Value Equities: Morningstar Global Value Target Market Exposure GR GBP; Japanese Bonds: Japanese Bonds: Morningstar Japan Treasury Bond TR GBP Hedged; Japanese Equities: Japanese Equities: Morningstar Japan GR GBP; Overseas Government Bonds: Overseas Government Bonds: iShares Overseas Government Bond Index (UK) D Acc in GB; UK Equities: UK Equities: Morningstar UK GR GBP; UK Government Bonds: Vanguard UK Government Bond Index Acc GBP in GB; US Equities: US Equities: Morningstar US Target Market Exposure TR GBP.
Past performance is not a reliable indicator of future results.
Introduction
Global markets showed a varied pattern in the first quarter of 2026, with performance differing across regions and asset classes. Equity returns diverged meaningfully, with Emerging Markets and Japan leading, while Europe and the U.S. lagged. Fixed-income markets also experienced shifts as interest rate expectations evolved.
These differences were driven by sector composition, starting valuations, and varying sensitivity to interest rate expectations. Market sentiment was further influenced by geopolitical developments, with rising oil prices increasing inflation concerns and leading to a reassessment of near-term rate expectations across global markets.
Equity: A More Varied Regional Picture

© Timeline Holdings Ltd 2026. Data as of 31/03/2026. Source: Morningstar (provided without liability). Gross Total Returns shown in GBP. Index returns do not account for fees. Quarterly data should not be viewed in isolation. Past performance is not a reliable indicator of future results.
U.S. equities experienced a volatile start to 2026, with indices reaching record highs earlier in the period before giving back the majority of these gains. With the developments in the currency markets, returns were impacted for UK investors by a weaker US dollar. Corporate earnings remained resilient, supported by large-cap technology and AI-related companies, although performance became more varied across the market as a broader range of sectors contributed to returns. More recently, markets weakened amid renewed uncertainty around developments in the Middle East, with the S&P 500 and Nasdaq declining modestly. Higher oil prices provided some support to energy stocks but also raised inflation concerns, contributing to uncertainty around the interest rate outlook and weighing on market sentiment.
UK equities made a modest contribution in the early part of 2026, with returns broadly flat at around 2.90% (Morningstar) and lagging stronger-performing regions. The FTSE 100 rose to a record high above 10,900.55 on 27 February, reflecting its exposure to energy (9.59%) and financial stocks (5.09%), as well as the global revenue base of its large-cap constituents (Morningstar). As the quarter progressed, some of these gains were reversed, with the index retracing earlier gains and moving back towards levels seen at the start of 2026. While energy and financials initially supported performance, a pullback in oil prices later weighed on energy stocks, reducing one of the key sources of strength. At the same time, declines became more broad-based across sectors, reflecting increased uncertainty around inflation, interest rates, and geopolitical developments. This, alongside continued underperformance in domestically focused companies, resulted in a more mixed outcome for the UK market.
According to Morningstar, European equities declined by 0.71% (GBP), with early gains reversing amid a weaker March. Initial strength was supported by attractive valuations and improving economic activity indicators, but sentiment weakened amid rising geopolitical tensions and higher oil prices. Economic data also showed signs of slowing, with the Eurozone Composite PMI, a measure of overall business activity across manufacturing and services, falling to a 10-month low, signalling some slowdown. Despite this, European equities held up a little better than U.S. equities, where large-cap growth stocks saw more pronounced weakness.
Emerging market equities recorded a return of 1.51% (GBP) over the period (Morningstar), outperforming some developed markets despite increased volatility. Performance was supported by strength in Asia, particularly Taiwan and South Korea, driven by continued demand linked to the AI and semiconductor supply chain. China also contributed positively, supported by improving economic data and stabilising investor sentiment. However, volatility increased in March due to rising geopolitical tensions and higher energy prices, which led to sharp but uneven declines across some Asian markets, particularly in South Korea. Despite this, overall performance remained resilient, reflecting underlying earnings strength and continued structural support from technology and domestic growth trends.
Japanese equities (according to Morningstar) gained 4.16% (GBP). Performance was supported by continued strength in corporate fundamentals, including improved capital allocation and shareholder returns linked to ongoing governance reforms. The market also benefited from exposure to semiconductor and industrial sectors, which remained supported by global demand. The market dip in March was relatively modest, with the market retaining most of its earlier gains.
The first quarter of 2026 highlighted notable regional divergence in global equity markets. Japan and the UK delivered solid positive returns, while Emerging Markets also ended the period modestly in positive territory. In contrast, the US and Europe experienced weaker performance, particularly towards the end of March. These differences largely reflect variations in market composition, valuation starting points and sensitivity to global developments, including interest rate expectations and geopolitical risks.
Equity Market Drivers: Value, Small Caps and Emerging Markets
Over the past 12 to 18 months, equity market leadership has become less concentrated, with performance extending beyond a narrow group of large-cap growth stocks. This reflects a gradual broadening of returns beyond highly concentrated markets, as highlighted by Morningstar, which notes increasing dispersion and reduced dominance of a small group of names. This shift has also been supported by rotation in investor positioning and changing market dynamics. In practice, this has been seen by investors increasingly reallocating away from concentrated growth exposures towards other, less concentrated segments of the market.
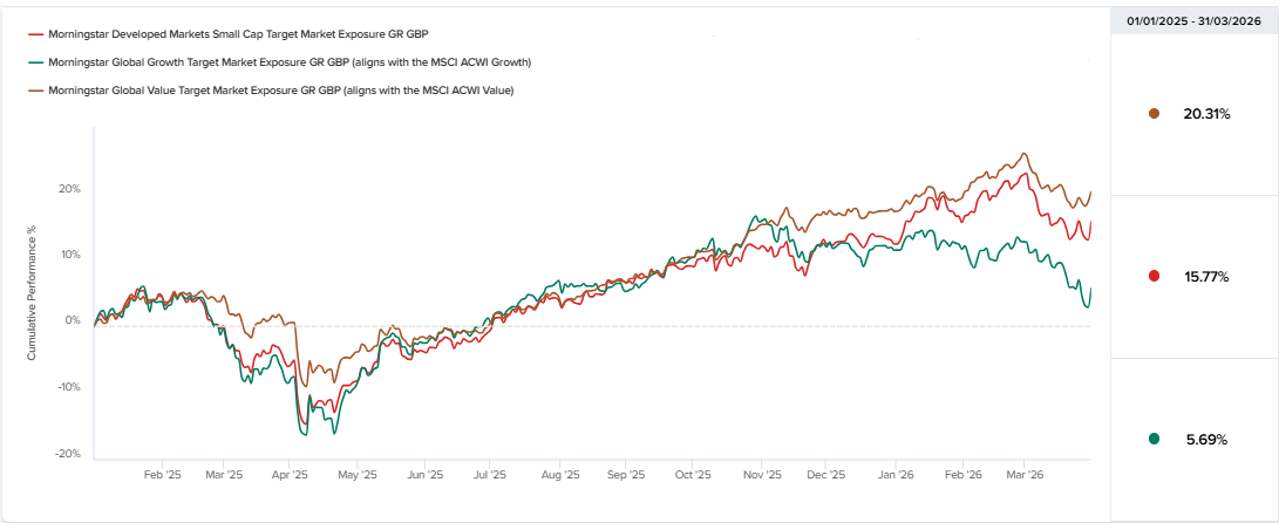
© Timeline Holdings Ltd 2026. Data as of 31/03/2026. Source: Morningstar (provided without liability). Gross Total Returns shown in GBP. Index returns do not account for fees. Quarterly data should not be viewed in isolation.
Over the past year, value and small-cap equities have shown periods of relative outperformance versus growth. Morningstar notes that value stocks have regained some leadership more recently, following a long period of growth dominance. This relative strength has also been observed in more recent market moves, with smaller companies at times outperforming large-cap technology stocks, particularly as interest rate expectations shifted. Higher interest rates have been an important driver, as smaller companies tend to be more sensitive to financing conditions, while growth stocks remain more exposed to long-term earnings expectations. Valuation also remains a key factor, with small caps trading at a discount to large caps and offering scope for re-rating as conditions stabilise. Overall, this reflects a partial broadening in market returns rather than a sustained shift in leadership, with performance remaining sensitive to macroeconomic conditions.
Emerging markets have delivered stronger performance relative to the U.S. in recent periods, with emerging markets outperforming U.S. equities in 2025. This has been supported by a combination of lower valuations relative to U.S. equities, currency effects, and stronger performance in non-U.S. regions. Asia has been a key contributor, particularly in markets with significant exposure to technology and semiconductors, benefiting from global demand and AI-related supply chains. Currency dynamics, including periods of U.S. dollar weakness, have also supported increased capital flows into emerging markets. However, performance has remained uneven across regions, reflecting differing domestic conditions and structural challenges that may persist.
Overall, recent performance reflects a gradual broadening in market participation, with returns no longer driven solely by a narrow group of large-cap growth stocks. While value, small caps, and emerging markets have contributed more meaningfully at times, leadership remains cyclical and sensitive to macroeconomic conditions. These recent market dynamics support the case for increased diversification when investing with cyclical movements in the performance of market segments. This broadening away from large growth should support investors who follow the evidence-based investing philosophy.
Fixed Income – A Quarter of Policy Uncertainty and Rising Yields
This quarter was characterised by shifting expectations around central bank policy, with markets reassessing the pace and timing of rate cuts. While inflation remained muted, it still sat above target across major regions, prompting a more cautious stance from central banks. Bond yields were volatile, and the yield curve showed signs of steepening, reflecting renewed inflation uncertainty and the mid-March escalation of conflict in the Middle East. Despite elevated yields, fixed income returns were mixed, with higher starting yields and income providing support, partly offset by price declines as yields rose.
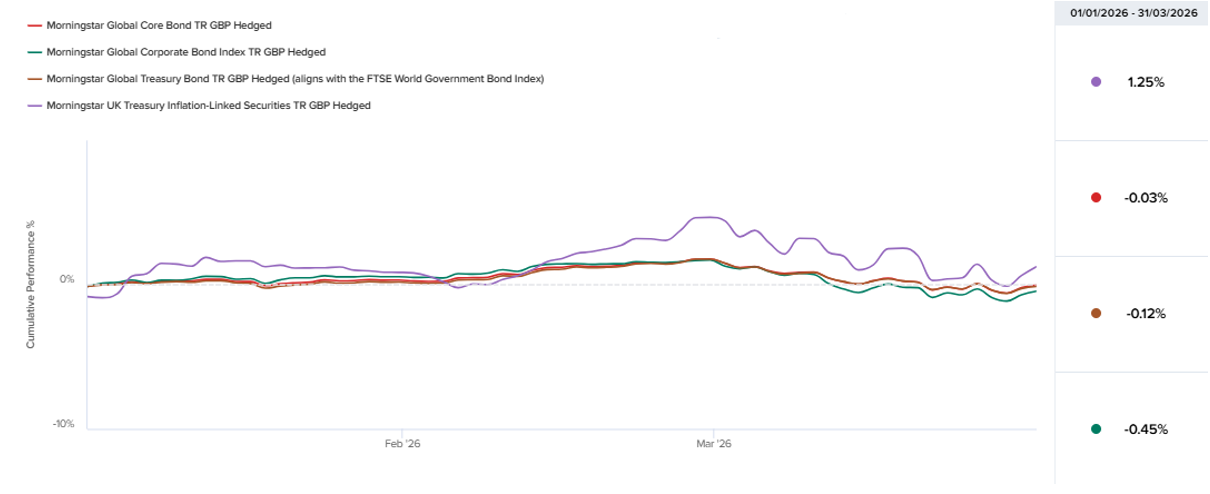
© Timeline Holdings Ltd 2026. Data as of 31/03/2026. Source: Morningstar (provided without liability). Gross Total Returns shown in GBP. Index returns do not account for fees. Quarterly data should not be viewed in isolation. Past performance is not a reliable indicator of future results.
In the U.S., Treasury yields remained elevated as markets pushed back rate cut expectations. Overnight rates were held between 3.50 and 3.75% in both January and March, signalling a data-dependent and gradual approach to easing. The outlook shifted to fewer expected cuts, while mixed labour data reinforced caution. Yields remained high, with the 10-year ending around 4.31% and the 2-year near 3.80%, reflecting tighter financial conditions.
UK gilt markets were volatile. The Bank of England held rates at 3.75%, with policy reflecting rising inflation risks linked to higher energy prices. Yields rose sharply towards quarter-end, with the 10-year reaching around 5.10%, its highest level since 2008, as markets reassessed the outlook for rates. The rise in yields was driven in part by higher energy prices and increased expectations for further rate tightening. Inflation-linked gilts saw mixed performance amid heightened inflation uncertainty. Investment-grade credit remained resilient, supported by stable fundamentals and income demand, although spreads widened slightly in March. As a result, income remained stable, while bond prices declined modestly due to higher yields and volatility.
In Europe, rates held steady, but the outlook shifted following the energy shock. Inflation forecasts were revised higher and growth expectations lower, with markets beginning to price in the possibility of rate hikes later in 2026. Government bond yields moved higher in line with global trends, with 10-year government bond yields at around 3.00% and 2-year yields at 2.61%. Despite this, credit markets remained resilient, supported by continued investor demand.
Emerging market bonds delivered mixed performance during the quarter, with hard currency debt influenced by higher U.S. yields and local currency bonds initially supported by easing inflation and attractive real yields. However, performance weakened later as Middle East tensions pushed oil prices higher, driving volatility and capital outflows, with currency weakness and widening spreads weighing on returns.
Overall, Q1 2026 highlighted diverging policy expectations across regions amid persistent inflation and geopolitical shocks. The Middle East conflict was a key driver of late-quarter repricing in energy and inflation expectations, shifting rate expectations particularly in the UK and Europe. Despite this, credit markets remained relatively resilient, while fixed income returns were mixed, with income and inflation protection helping to offset the impact of rising yields.
The Role of REITs in a Portfolio
As part of this update, we also include a short focus on a broader market theme to provide an additional market insight. This quarter, we look at Real Estate Investment Trusts (REITs), perhaps a timely topic given their sensitivity to interest rates and their role within diversified portfolios.
REITs have historically exhibited return characteristics broadly similar to equities, although with periods of relative underperformance. As illustrated in the chart, while global REITs have participated in long-term market growth, their cumulative returns have generally lagged broader equity markets over time. This reflects the fact that REITs are not a distinct return driver, but form part of the broader equity risk spectrum, with performance influenced by common factors such as market conditions, valuation cycles, and interest rates.

© Timeline Holdings Ltd 2026. Data as of 31/03/2026. Source: Morningstar (provided without liability). Performance is shown from the start date of the newest index (23/06/2008 – 31/01/2026). Gross Total Returns shown in GBP. Index returns do not account for fees. Past performance is not a reliable indicator of future results.
The period from 2022 onwards provides a clear example of this dynamic. As central banks raised interest rates aggressively across developed markets, government bond yields increased materially, leading to reduced relative attractiveness of property income. This resulted in lower valuations across listed real estate, and REITs underperformed broader equity markets despite relatively stable rental income and occupancy levels.
In 2025, performance remained subdued relative to equities. The Morningstar US Real Estate Index delivered modest returns compared to stronger gains in broader equity markets, reflecting continued concentration of returns in growth and technology sectors. However, global listed real estate still generated positive returns overall, demonstrating resilience despite macroeconomic pressures and highlighting the stability of underlying income streams. REIT yields also remained relatively attractive compared to other asset classes.
Into early 2026, there are early signs of stabilisation rather than a full recovery. As shown in the chart, REITs have participated in the broader market rebound, but to a lesser extent, with performance continuing to lag equities overall. This reflects ongoing sensitivity to interest rate expectations, while relatively attractive valuations may provide some support going forward, although sentiment remains uncertain amid geopolitical developments.
Real estate returns vary across vehicles and are influenced by broader macroeconomic factors, particularly interest rates, meaning it does not consistently act as a reliable diversifier. As well as through broad index fund investing, where equity indices capture listed REITs, investors may already have indirect exposure through equities in other sectors, making additional allocation less essential. This can be seen across different areas of the market. In data centre real estate, companies such as Equinix and Digital Realty provide the infrastructure that supports large technology firms. As a result, investors holding broad equity indices already have exposure to similar underlying drivers, such as AI demand and technology spending, limiting the diversification benefit of additional allocation. A similar dynamic can be observed in companies such as McDonald’s, where a significant portion of earnings is linked to property ownership through franchise models. This highlights how real estate exposure can already be embedded within equity allocations.
Performance Commentary
Timeline Multi-Asset Fund Range
The funds have delivered returns broadly in line with global market performance, reflecting their underlying passive and market-aligned structure, and have tracked closely to the Tracker MPS over the period. Global equities showed mixed performance in Q1 2026 rather than sustained strength, with periods of resilience earlier in the quarter followed by weakness towards March due to rising oil prices, geopolitical tensions, and reduced expectations for rate cuts.
Over the period, the TM Timeline 100% Equity Fund returned approximately 7.60%, broadly in line with the global market, which returned around 7.09%. This highlights the consistency of the implementation and the ability to capture market returns effectively. In more recent months, performance has been weaker, reflecting this more volatile market environment. Despite this, the fund has continued to track its benchmark and the Tracker MPS closely, with only modest deviations.
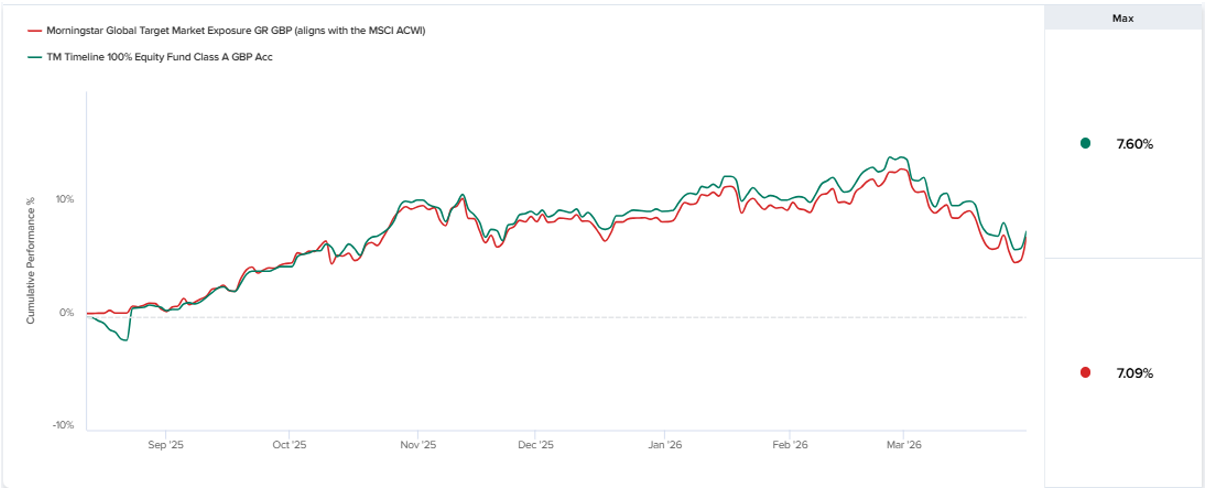
© Timeline Holdings Ltd 2026. Data as of 31/03/2026. Source: Morningstar (provided without liability). Based on Daily Total Returns (net of all fund charges). Excludes taxes and inflation, which reduce actual returns. Past performance is not a reliable indicator of future results.
Important: These funds have been trading for less than a year (launched 12 August 2025); therefore, performance data is limited and does not provide a complete picture of how they may perform across different market conditions. This is provided for adviser use only to monitor fund progress and must not be shared with retail clients or viewed in isolation. Refer to the full Prospectus and KIID before assessing suitability.
Timeline Tracker
Markets were volatile during the period, driven by rising oil prices and renewed geopolitical tensions, which increased inflation concerns and reduced expectations for near-term rate cuts. Tracker portfolios broadly followed global market movements, reflecting their market-cap-weighted approach. The Tracker 100 portfolio experienced a modest decline of around -2.23%, in line with weaker global equity performance, with returns influenced by its high allocation to North America as US equities weakened. Exposure to emerging markets and Europe provided some diversification, although this was not sufficient to offset broader market weakness. The fixed income-focused Tracker 0 delivered a smaller decline of -0.32%, reflecting its more defensive positioning. This was supported by fixed income markets, which provided relative stability despite volatility in equities, resulting in lower overall volatility and smaller drawdowns.
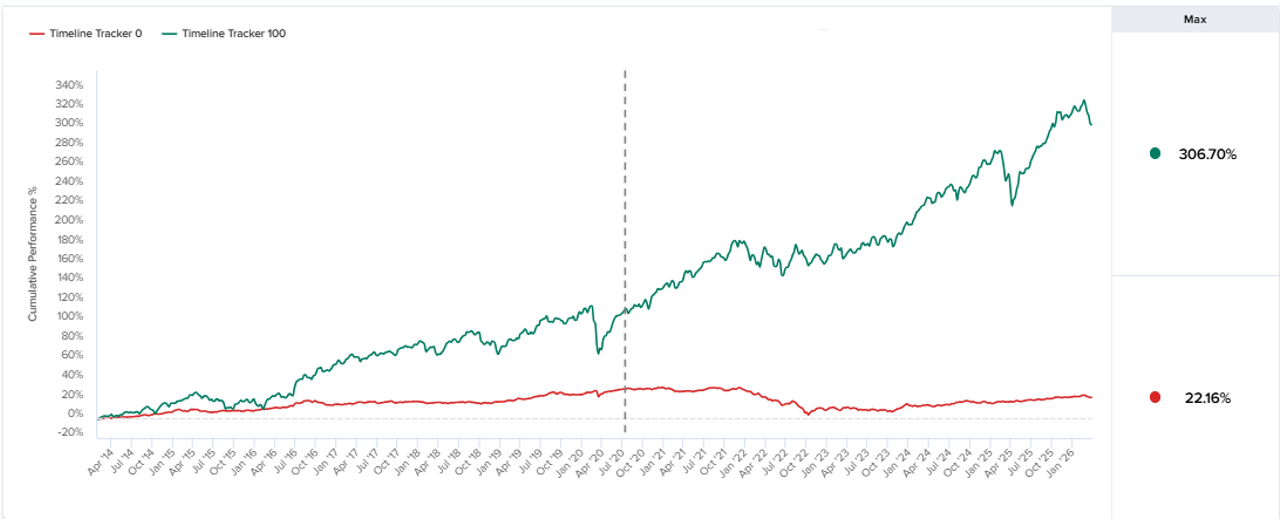
© Timeline Holdings Ltd 2026. Data as of 31/03/2026. Source: Morningstar (provided without liability). Based on Daily Total Returns (net of all fund charges and our DFM fee). Excludes taxes and inflation, which reduce actual returns. MPS launched on 15/07/2020. Pre-2020 back tests the funds held at launch to the inception date of the newest fund. Our 10% drift-tolerance rebalancing methodology applies throughout. This includes simulated data and does not represent actual client returns. Past performance (actual or simulated) is not a reliable indicator of future results.
Over the long term, Tracker performance has remained strong relative to RPI, driven primarily by equity market returns. Cumulatively over the last 10 years, Tracker 100 would have delivered 227.4% (when using simulated data to show hypothetical data prior to launch), which is significantly ahead of RPI at 129.3%, and also ahead of blended peer group and market comparator. This reflects sustained strength in global equities, highlighting market efficiency and the ability to capture the equity risk premium over time.
By comparison, fixed income has delivered more modest returns. Tracker 0 has lagged RPI and the blended comparator over five and 10 years, particularly during periods of elevated inflation and rising interest rates, which have weighed on global bond markets. Bond performance has been impacted by rising yields, which reduce the value of existing holdings. In line with global fixed income markets, Tracker 0 has continued to provide diversification and stability during periods of market stress, but has faced challenges in recent years due to the shift from a low-interest-rate environment to a higher-rate regime.
Timeline Classic
The Timeline Classic range aims to capture small-cap and value opportunities within global equity markets. During the period, performance reflected a more volatile market environment, with global equities showing mixed returns. The Classic 100 portfolio delivered a return of approximately 0.73%, while the more defensive Classic 0 portfolio delivered a modest positive return of around 0.64%. The equity portfolio was impacted by the broader market pullback towards the end of the period. However, value and small-cap equities performed relatively well, which helped to support returns.

© Timeline Holdings Ltd 2026. Data as of 31/03/2026. Source: Morningstar (provided without liability). Based on Daily Total Returns (net of all fund charges and our DFM fee). Excludes taxes and inflation, which reduce actual returns. It includes the current discretionary management (Dec 2020 – present) and the period it was managed as an advisory model (Oct 2014 – Dec 2020). Pre-2014 back tests the funds held at launch to the inception date of the newest fund. Our 10% drift-tolerance rebalancing methodology applies throughout. This tracks the model’s history and includes simulated data; it does not represent actual client returns. Past performance (actual or simulated) is not a reliable indicator of future results.
Over the long term, Classic performance has remained strong relative to RPI, supported by exposure to global equities and factor tilts towards value and small-cap stocks. Cumulatively over the last 10 years, Classic 100 has delivered 174.9%, ahead of RPI at 129.3% and the blended peer group a 162.9%, although below the market comparator at 205.3%. This reflects the contribution from equities, alongside the more variable performance of factor exposures over time.
On the fixed income side, returns have been more modest. Cumulatively over the last 10 years, Classic 0 has returned 15.9%, significantly below RPI at 41.7% and the blended peer group at 21.1%, although above the market comparator at 10.5%. This underperformance is particularly evident during periods of elevated inflation and rising interest rates, which have weighed on global bond markets. Higher interest rates have been a headwind for bond returns over the period.
Overall, the Classic range continues to demonstrate the role of equities and factor tilts in supporting long-term returns, while fixed income provides diversification despite a more challenging return environment in recent years.
Timeline ESG Tracker
The ESG Tracker portfolios, which closely track global markets while incorporating sustainable investing considerations, reflected the more volatile market environment during the period. Much like the broader market, performance was mixed, with weakness towards the latter part of the quarter. The 100% equity ESG Tracker portfolio delivered a return of around -2.91%, reflecting the decline in global equity markets and the underweight to the energy sector due to ESG screening. The fixed income-focused ESG Tracker 0 portfolio delivered a smaller decline of around -0.47%, supported by the relative stability of bond markets.
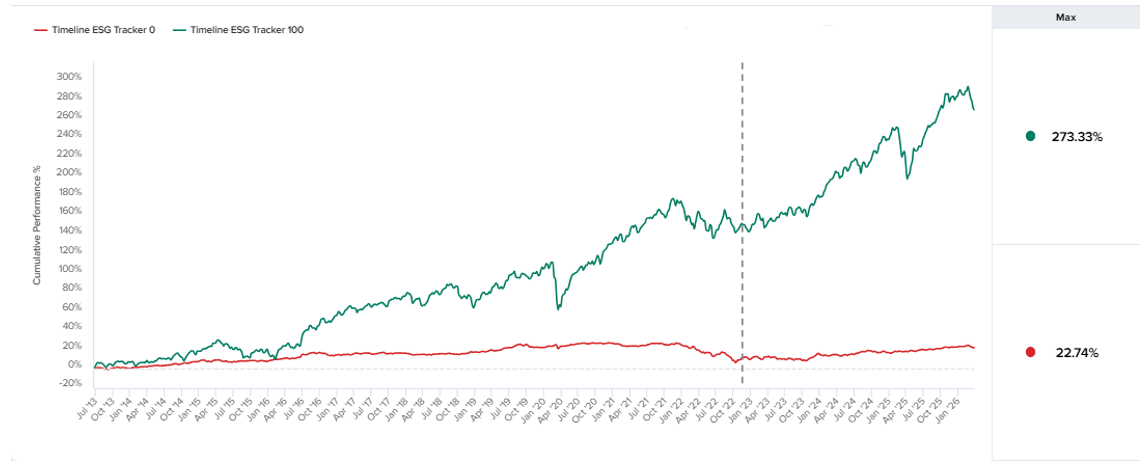
© Timeline Holdings Ltd 2026. Data as of 31/03/2026. Source: Morningstar (provided without liability). Based on Daily Total Returns (net of all fund charges and our DFM fee). Excludes taxes and inflation which reduce actual returns. MPS launched on 16/11/2022. Pre-2022 back tests the funds held at launch to the inception date of the newest fund. Our 10% drift-tolerance rebalancing methodology applies throughout. This includes simulated data and does not represent actual client returns. Past performance (actual or simulated) is not a reliable indicator of future results.
Over the long term, ESG Tracker performance has remained strong relative to RPI, supported by exposure to global equity markets while incorporating ESG considerations. Cumulatively over the last 10 years, ESG Tracker 100 would have delivered 198.8% (when using simulated data to show hypothetical data prior to launch), significantly ahead of RPI at 129.3% and the Morningstar peer group at 162.9%, although below the market composite index comparator at 226.5%. This reflects the continued strength of global equities, alongside the impact of ESG tilts, including sector exclusions such as energy.
By comparison, fixed income has delivered more modest returns. ESG Tracker 0 has lagged RPI and the blended comparator over the last 5 and 10 years (when using simulated data prior to launch), particularly during periods of elevated inflation and rising interest rates. The shift to a higher interest rate environment has been a headwind for bond returns.
Overall, the ESG Tracker range continues to demonstrate the ability to capture long-term equity returns while incorporating ESG considerations, with fixed income providing diversification despite a more challenging return environment in recent years.
Timeline ESG Classic
The Timeline ESG Classic portfolios aim to incorporate ESG characteristics while capturing the small-cap and value premia within global equity markets. During the period, performance reflected the more volatile market environment, with global equities showing mixed returns.
The equity-only ESG Classic 100 portfolio delivered a return of approximately -0.14%, broadly in line with wider equity market movements, and reflecting the underweight to energy due to ESG screening. However, the portfolio benefited from its tilt towards value and small-cap equities, which performed relatively well and helped support returns. The ESG Classic 0 portfolio, which is more focused on fixed income, delivered a relatively stable return of around 0.48%, reflecting the more resilient nature of bond markets over the period.
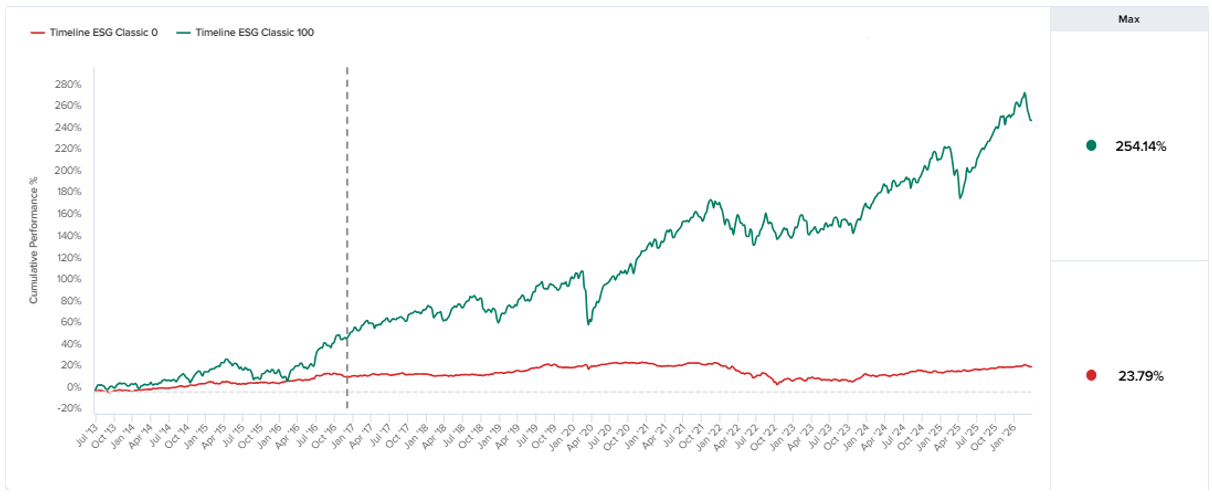
© Timeline Holdings Ltd 2026. Data as of 31/03/2026. Source: Morningstar (provided without liability). Based on Daily Total Returns (net of all fund charges and our DFM fee). Excludes taxes and inflation which reduce actual returns. It includes the current discretionary management (Dec 2020 – present) and the period it was managed as an advisory model (Nov 2016 – Dec 2020). Pre-2016 back tests the funds held at launch to the inception date of the newest fund. Our 10% drift-tolerance rebalancing methodology applies throughout. This tracks the model’s history and includes simulated data; it does not represent actual client returns. Past performance (actual or simulated) is not a reliable indicator of future results.
Over the long term, ESG Classic performance has remained strong relative to RPI, supported by exposure to global equities alongside factor tilts towards value and small-cap stocks, while incorporating ESG considerations. Cumulatively over the last 10 years, ESG Classic 100 would have delivered 183.5% (when using simulated data to show hypothetical data prior to launch), ahead of RPI at 129.3% and the Morningstar peer group at 162.9%, although below the market composite index comparator at 226.5%. This reflects the contribution from equities, alongside the impact of ESG and factor tilts over time.
On the fixed income side, returns have been more modest. Cumulatively over the last 10 years, ESG Classic 0 would have returned 11.2% (when using simulated data to show hypothetical data prior to launch), significantly below RPI at 41.7% and the Morningstar peer group at 21.1%, and slightly above the market comparator at 10.5%.This underperformance reflects the impact of elevated inflation and rising interest rates, which have weighed on global bond markets. Rising yields have reduced bond prices, limiting overall returns.
Overall, the ESG Classic range continues to demonstrate the role of equities and factor tilts in supporting long-term returns while incorporating ESG considerations, with fixed income providing diversification despite a more challenging return environment in recent years.
Closing Thoughts
It’s understandable for clients, and all market participants alike, to feel apprehension surrounding the year ahead. We’re unfortunately still in the thick of this uncertainty, with little indication of when this might end. Volatility is likely to rear its head in bond and equity markets alike throughout the year. Inflation is also likely to start to creep back up with energy and oil likely being the driving forces behind this.
As a potential silver lining on the horizon, guiding us through the current reality, we should remember that this too shall pass. While this may be uncharted waters for oil, markets have continued to provide returns after periods of conflict, even on a global scale, in the past. Timeline’s Chart seems timelier than ever and serves as a reminder of the unstoppable force the markets have been previously in response to uncertain times like these. To potentially help aid client conversations, the Timeline Chart was recently updated and is available to all advisers in their ‘Resources’ section. We find the ‘Crisis & Events’ page (also included on the page below) a particularly useful resource in the current climate.
We are likely preaching to the converted for our advisers, but the message is nonetheless as important now as it always is. The ability to focus on the longer-term plan and ignore short-term noise is what often supports success over the longer term.

 Production