


It feels as though the year has sped away from us once again. With the third quarter drawn to a close, the recurrent themes of this year have reappeared, including global political unrest and lacklustre economic growth closer to home.
Here’s your guide to quarter three in review, and a look at the economic outlook moving forward.
UK debt, markets, and growth
It’s been a quarter of conflicting signals in the UK, with the FTSE 100 reaching an all-time high in September and wider reports suggesting a struggling economy.
Recently released data from the Office for National Statistics (ONS) indicated that the economy failed to grow in July, following a choppy period of month-to-month GDP figures. Taking a step back, there is more to the picture: three-month GDP growth has remained positive; however, it has slowed for the third consecutive period, pointing to a far from promising economic outlook.

Source: ONS
So, why is there a disparity between the markets and actual UK economic growth? We need to remember that market indices are not always reflective of the country in which they are based. Companies are increasingly international and have global revenue streams.
Moreover, firms headquartered in one country may well be listed on an international index. While markets can reflect long-term economic patterns in a given country, there can be a disconnect between short-term equity movements and the wider economy.
When equity markets are powering ahead and reaching new highs, bond markets can take a bit of a back seat. However, they are incredibly important for understanding the wider economic landscape, and UK investors should be keeping a keen eye on the government debt market. In the third quarter, there has been considerable noise around UK government borrowing, particularly concerning the cost and size of this debt. Over the first five months of the fiscal year, government debt has reached £83.8 billion.
Seasoned investors may have noticed that the 30-year gilt yield – effectively the interest rate at which the government can borrow money over 30 years – reached its highest level since 1998 in mid-September. This increased rate means the government will face significantly higher outgoings simply to service the cost of its growing debt.
Some market analysts suggest this could be a sign of economic mismanagement and Labour struggling to maintain fiscal credibility. The truth, however, is slightly more complicated. These increased debt costs have been seen across the developed world.
Another factor partly responsible for the increase in UK debt costs is the Bank of England’s shift towards quantitative tightening, the opposite of quantitative easing, meaning the BoE is selling the bonds it purchased during the 2008 financial crisis.
When the supply of these bonds increases, their prices fall and yields rise. Higher yields, in turn, push up servicing costs for the issuer. The BoE recently announced it was reducing the rate at which it is selling these bonds, which has helped steady markets and slightly ease yields.
It is important to stress that this is unlikely to be a repeat of the mini-budget yield chaos of 2022.
The OBR has, though, confirmed that, while the UK may not have the highest debt-to-GDP ratio, it is certainly above average, underlining the increasing pressure on public finances – crucial in the lead-up to 26 November.

Source: OBR
To tax or not to tax, that is the question
The Budget is set for 26 November, and as expected, there has been plenty of speculation around whether Reeves will be able to keep her promise not to increase taxes on working people. Currently, the Chancellor faces myriad issues, including mounting pressure to balance public finances while improving economic growth within the UK’s stagnating economy, alongside the challenge of servicing expensive public debt. Given this complicated backdrop, what is Reeves likely to tackle in the Budget?
It is looking increasingly likely that Reeves will have to swallow her pride and abandon Labour’s original plan of not raising taxes, but “stealth taxes” is also on the cards: simply extending the freeze on the Income Tax thresholds, pushing more working people into higher tax brackets. The increase in income tax and the tax bracket freeze are predicted to raise £60 billion and £48 billion, respectively, in additional revenue up until 2030.
Speculation surrounding further changes to pensions and Inheritance Tax (IHT) is perhaps the most prominent at the moment. After announcing that pensions will now be classified as part of the deceased’s estate, thereby increasing IHT receipts, potentially exempt transfers (PETs) are also under scrutiny. The two main avenues for implementing this would be either introducing a lifetime cap on PET values or changing the tapered IHT relief that these transfers receive if the gifter dies before seven years have passed.
Other considerations, such as freezing IHT nil-rate band thresholds and removing the “triple lock” on the State Pension, are recurring themes around Budgets. While removing the triple lock would be a major upheaval for retirees, freezing thresholds remains an easy win for the Treasury.
A potential cut to the Cash ISA Allowance has gained traction in recent months. This was speculated to be implemented in Reeves’ Mansion House address earlier this year, but it did not materialise. Another popular option is a shake-up in property taxes, in the form of a potential “land tax” versus “mansion tax” or reforms to council tax. All areas have been discussed, including implementing Capital Gains Tax (CGT) on the sale of primary residences. Given the sheer number of possibilities in this area, it is not unreasonable to expect at least one of these ideas to appear in November.
The truth is, all of this is still just speculation. News outlets thrive on fuelling debate by highlighting the most controversial possibilities. The reality is that no one really knows what will be in the Budget yet, so the key is not to panic.
“You ever have second thoughts about something?” – Donald J Trump, 2018
Trump, love him or loathe him, has been in office for just eight short months. Campaigning on big promises of reduced immigration, reshoring production to the US, and helping the everyday working man, he rallied many in America who felt they were being forgotten. Now that some distance has been gained from the campaign trail, has Trump’s grand vision for the working class come true? And what impact have these policies had on the US economy so far this year?
In September, Trump announced an overhaul of the H-1B visa system in the US, which is effectively a skilled workers’ visa. Companies looking to hire skilled workers from abroad would face a $100,000 fee, designed to make employers question whether it would be more beneficial to hire Americans. Unsurprisingly, some economists have suggested that this will dampen US growth heading into 2026.
“Brain drain” is already a concern for US companies, with some of the brightest international graduates potentially being forced to leave the country without employment opportunities.
The actual impact of reduced immigration on the economy is still being assessed and will likely take time and detailed analysis before the correlations can be fully understood. Initial estimates by Goldman Sachs predict the US GDP could fall by as much as 30–40 basis points (from 2.5%) compared with 2023/24 as a result of the reduction. With many of the largest technology companies affected most by the immigration changes, this figure may well come to pass.
“The most beautiful word in the dictionary”, tariffs, has also continued to have a knock-on effect on the US economy and growth this quarter. The major expectation from investors has been the impact of tariffs on inflation levels. With a full quarter for businesses to adjust prices and behaviour, the outcome has largely been in line with economists’ forecasts.
August data from CNBC showed inflation rising to 2.9%, the highest level since Trump returned to office in January. The higher figure has not dampened Wall Street, with markets continuing to power ahead with positive returns. Markets appear to be pricing in a further cut to US interest rates over the next quarter, after the Fed reduced rates for the first time in nine months (according to JP Morgan) by 25 basis points in September. Some analysts hope this marks the start of a rate-cutting cycle into 2026. While Powell is likely to wait for more concrete data before moving in that direction, the move has helped fuel a positive market reaction going into the final quarter of the year.
We are still in the infancy of Trump’s second tenure in the White House. While the first few months have been packed with headline-grabbing antics, more is likely to follow from the Republicans. Timeline would like to remind readers that no one can accurately predict how markets will behave in the short term. Even with uncertainty in the wider economy, US markets continue to show strength. It remains important to stay invested and focus on the future by sticking to a robust financial plan.
The quarter has provided an interesting economic and political backdrop for markets. We will now delve into this, looking at how various asset classes have performed and what has been driving portfolio returns.
Asset Class Review
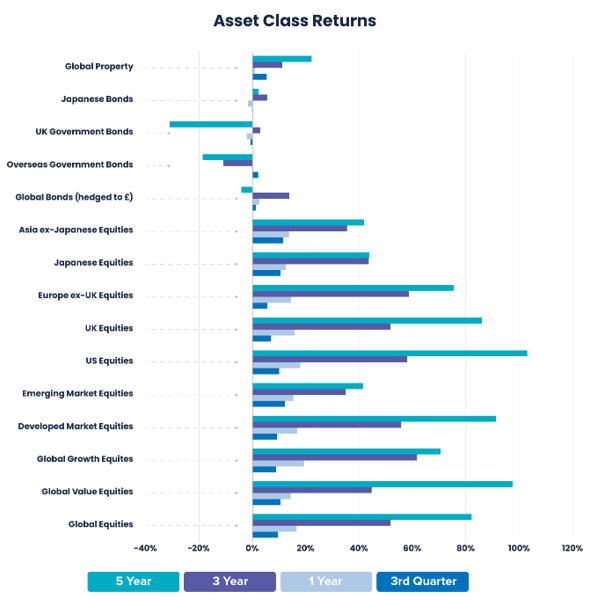
Proxies: Asia ex-Japanese Equities: Morningstar Asia Pacific ex-Japan Large-Mid Cap GR GBP; Developed Market Equities: Developed Market Equities: Morningstar Developed Markets Target Market Exposure GR GBP; Emerging Market Equities: Emerging Market Equities: Morningstar Emerging Markets Target Market Exposure GR GBP; Europe ex-UK Equities: Europe ex UK Equities: Morningstar Developed Europe Target Market Exposure GR GBP; Global Bonds: Global Bonds: Vanguard Global Bond Index Hedged Acc GBP in GB; Global Corporate Bonds (hedged £): Vanguard Global Bond Index Hedged Acc GBP in GB: Global Equities: Global Equities: Morningstar Global Markets GR GBP; Global Growth Equites: Global Growth Equites: Morningstar Global Growth Target Market Exposure GR GBP; Global Property: Global Property: Morningstar Global Real Estate GR GBP; Global Value Equities: Global Value Equities: Morningstar Global Value Target Market Exposure GR GBP; Japanese Bonds: Japanese Bonds: Morningstar Japan Treasury Bond TR GBP Hedged; Japanese Equities: Japanese Equities: Morningstar Japan GR GBP; Overseas Government Bonds: Overseas Government Bonds: iShares Overseas Government Bond Index (UK) D Acc in GB; UK Equities: UK Equities: Morningstar UK GR GBP; UK Government Bonds: Vanguard UK Government Bond Index Acc GBP in GB; US Equities: US Equities: Morningstar US Target Market Exposure TR GBP. Performance periods: 3rd Quarter: 30/06/2025 – 30/09/2025, Year: 30/09/2024 – 30/09/2025; 3 Year: 30/09/2022 – 30/09/2025, 5 Year: 30/09/2020 – 30/09/2025.
Equities – Broadened resilience across borders
In comparison with the first half of the year, global equities experienced an upward trend during Q3, with major benchmarks reaching or nearing record levels by late September. Leadership broadened beyond the early-year concentration as more sectors and regions contributed, including greater participation outside the US.
US equities demonstrated upward momentum through the quarter, with broader participation than earlier in the year. Beyond mega-cap technology, sectors such as healthcare, financials, and industrials, which are tied to capital spending, contributed more steadily, as companies meeting guidance and showing solid cash generation were rewarded.
European equity markets delivered modest gains during Q3 2025, with leadership rotating between technology and select industrial sectors, while automotive and energy segments remained moderately volatile due to the impact of tariffs. Europe also experienced periods of net buying, aided by cheaper valuations compared with the United States, along with reliable dividends and buybacks. In the UK, the FTSE 100 closed Q3 at a record high, according to Reuters, with energy and mining often supporting returns.
Emerging markets held up well, with Taiwan and Korea leading the way due to strong demand for AI and high-performance computing. Brazil and Mexico also benefited from steadier local conditions. China was more mixed throughout the quarter, with benchmark lending rates remaining at current levels, combined with improved liquidity, which boosted general market sentiment. However, these measures did not produce a clear uptrend for the broader markets. India gained over the quarter, but its progress was uneven, as a weaker rupee and moves in the concentrated IT sector influenced returns. Overall, emerging markets pushed towards the top of their recent range, though performance remained varied by country.
Japan’s equity market advanced and hovered near record levels into late September. When the yen weakened, exporters outperformed, boosting industrial and technology shares. Currency moves added some volatility, but ongoing governance reforms and improving shareholder returns remained supportive.

Source: Timeline (01.07.25 to 24.09.25)
Growth stocks remained positive but were less dominant than earlier in the year, as gains broadened beyond mega-cap technology. Value stocks and cyclicals contributed more meaningfully, with financials and energy playing a role, while defensive sectors provided an additional layer of stability and support.

Source: Timeline (01.07.25 to 23.09.25)
This quarter marked a period of significant evolution for global equities, with Emerging Markets and Japan leading, and the US, UK, and Europe also in positive territory. The rally extended beyond US mega-cap technology stocks as small caps and cyclical sectors re-engaged. Strong inflows into European and Emerging Markets highlighted a shift towards a more diversified landscape. The quarter’s positive performance was shaped by central bank actions and specific drivers, such as demand for AI, concluding with major benchmarks at elevated levels.
Fixed Income – A Quarter of Divergent Policies
The fixed income market experienced notable shifts in the third quarter as major central banks began implementing different rate policies. The overall theme was one of elevated volatility and a steepening yield curve, marking the return of higher yields for long-duration bonds. Global bonds held up, with core bond benchmarks rising by roughly 1.1% over the period.
Core US bonds edged higher during the quarter, driven by the Fed’s 0.25% rate cut in September. This action immediately steepened the yield curve, reflecting a marked difference in duration performance. According to the Federal Reserve Bank of St Louis, short-term yields fell, with the 2-year near 3.6%, while the long end remained elevated, with the 10-year US Treasury yield at 4.15% and the 30-year yield at 4.75%. For corporate bonds, Bloomberg confirms that the investment-grade sector saw credit spreads tighten to 0.72% close to multi-decade lows. The very narrow gap between yields on corporate bonds and US Treasuries suggests that investors are not being adequately compensated for the additional risk of holding corporates. This makes core US Treasury bonds relatively more attractive, as they offer safety without a meaningful sacrifice in return.
In the UK, gilts and sterling credit moved within narrow ranges. The Bank of England (BoE) cut its rate to 4% in August and then held in September, maintaining a cautious stance. Even so, the gilt curve remained prone to steepening, primarily due to the UK government’s sizable funding needs. Barclays confirms that the 10-year gilt settled around 4.7%, while the 30-year eased to about 5.5% after an earlier peak near 5.7%, its highest level since 1998. The BoE provided some technical relief by slowing its quantitative tightening and reweighting bond sales away from the ultra-long end.
Overall, this quarter was defined by divergent central bank policies, with the Fed’s rate cut causing the U.S. yield curve to steepen. Despite the volatility, core bonds edged higher and credit markets remained well supported, although longer-dated bonds were pressured by heavy sovereign issuance.
Uranium – A Strategic Commodity on the Rise
As part of our quarterly commentary, we often include a spotlight on a theme outside the core asset classes to provide a broader perspective on what is shaping markets. This quarter, the focus is on uranium, given its growing role in the clean energy transition and energy security.
Uranium has emerged as a compelling alternative among energy commodities, drawing investor interest amid the global push for clean power and energy security. While its spot price can be volatile, recently moving into the low-$80s per pound (close to a 10-month high), long-term demand for nuclear power remains strong. This has created a compelling market where big-picture fundamentals are attracting serious investors.
The market’s performance reflects a straightforward imbalance: demand is rising while supply is limited. Industry projections suggest uranium requirements will increase by about 28% by 2030 and more than double by 2040, supported by roughly 70 reactors under construction and pro-nuclear21. Supply, however, is concentrated in a few countries, leaving the market vulnerable to disruptions from weather, logistics, or labour. To build resilience, the US is expanding domestic fuel capacity through multi-year contracts and has signalled plans to create a strategic uranium reserve to reduce exposure to Russian supply and support long-term nuclear generation. This forms part of a wider effort to reinforce the Western fuel cycle22.

Source: OECD Nuclear Energy Agency (NEA) & International Atomic Energy Agency (IAEA) (2024)
This fundamental tightness in the long-term market contrasts with the smaller, more reactive day-to-day market. Because the spot market (current market price) is so small, even a small amount of extra buying can cause prices to jump sharply. The long-term price is much more stable, as most of the world’s nuclear plants secure their fuel through multi-year contracts.
Still, as more investors and trading firms enter this market, its volatility is likely to remain high.
Performance Commentary
Timeline Tracker
During the penultimate quarter, the Tracker portfolios, designed to closely mimic global market indices, continued their strong performance after the volatility earlier in the year. The Tracker 100% Equity portfolio returned a robust 9.52%, closely mirroring global markets.
This reflects the relatively calm conditions of the quarter following the swift recovery from US tariffs earlier this year. Both growth and value stocks delivered positive returns, with emerging markets leading global performance. In the fixed-income-only Tracker 0 portfolio, performance was relatively flat, returning 0.79% in line with global markets. With rate cuts expected in the US over the next year, this should provide a more positive environment for bonds in the near future.

© Timeline Holdings Ltd 2025: All data is up to the latest available price. Past performance is no guarantee of future return. The data is sourced from Morningstar API, for which we are not responsible. Where Morningstar may have missing data or inaccurate data, we are not responsible. Careful consideration has been taken to ensure that the information is correct, but it neither warrants, represents nor guarantees the contents of the information, nor does it accept any responsibility for errors, inaccuracies, omissions or any inconsistencies herein. Percentages may not total 100 due to rounding.
Performance figures are net of fund manager charges. This tracking error is calculated by Morningstar over a 10-year period and then annualised. Where tracking error is not displayed, the comparable Index was not available in Morningstar Direct in order to calculate. The data for the indices and the underlying funds of the portfolios is sourced from Morningstar API. We are not responsible for their presence or accuracy. This chart shows the cumulative performance
% of the selected financial assets from the starting point.
Reviewing the portfolios over the longer term, we can see that they have continued to deliver strong performance compared with the composite and RPI comparators. The Tracker 100 has benefited from strong equity markets over the past several years, returning 258.32% over the past 10 years. This highlights the efficiency of global markets and the strength of the market premium in portfolio returns. However, the fixed income portion has struggled, much like the wider market, due to low interest rates spurred by the Covid pandemic. While performing in line with peers and the composite portfolio, high inflationary years mean it has lagged behind RPI.
Timeline Classic
The Classic range tilts towards small-cap and value stocks, aiming to leverage these premiums for long-term outperformance of global markets. This evidence-based approach has performed well with the uptick in value stocks over the past five years. This quarter, both growth and value equities performed positively and broadly in unison. The equity-heavy Classic 100 portfolio returned 9.94% over the quarter. Small-cap also performed well this quarter, enhancing returns. The fixed income portion of the portfolios performed similarly to the Tracker range, with a 0.67% return for the quarter.

© Timeline Holdings Ltd 2025: All data is up to the latest available price. Past performance is no guarantee of future return. The data is sourced from Morningstar API, for which we are not responsible. Where Morningstar may have missing data or inaccurate data, we are not responsible. Careful consideration has been taken to ensure that the information is correct but it neither warrants, represents nor guarantees the contents of the information, nor does it accept any responsibility for errors, inaccuracies, omissions or any inconsistencies herein. Percentages may not total 100 due to rounding.
Performance figures are net of fund manager charges. This tracking error is calculated by Morningstar over a 10-year period and then annualised. Where tracking error is not displayed, the comparable Index was not available in Morningstar Direct in order to calculate. The data for the indices and the underlying funds of the portfolios is sourced from Morningstar API. We are not responsible for their presence or accuracy. This chart shows the cumulative performance
% of the selected financial assets from the starting point.
The Classic 100 has continued to perform in line with expectations over the longer term. Returning 193.62% over the past 10 years, it is positive to see the strong performance across both core ranges. The fixed income portion of the portfolio has lagged behind RPI, as expected, given the periods of heightened inflation and high interest rates.
Timeline ESG Tracker
The ESG Tracker portfolios, which closely track the global market while incorporating additional considerations of sustainable and ethical investing, performed well in the quarter thanks to the continued strength and recovery of global markets following the volatility in spring. The 100% equity ESG Tracker portfolio returned 9.65%, benefiting from the resilience of global stock markets. On the fixed income side, conditions remained calm and bond prices were largely flat, with the 100% bond ESG Tracker 0 portfolio returning 0.69% over the third quarter.

© Timeline Holdings Ltd 2025: All data is up to the latest available price. Past performance is no guarantee of future return. The data is sourced from Morningstar API, for which we are not responsible. Where Morningstar may have missing data or inaccurate data, we are not responsible. Careful consideration has been taken to ensure that the information is correct but it neither warrants, represents nor guarantees the contents of the information, nor does it accept any responsibility for errors, inaccuracies, omissions or any inconsistencies herein. Percentages may not total 100 due to rounding.
Performance figures are net of fund manager charges. This tracking error is calculated by Morningstar over a 10-year period and then annualised. Where tracking error is not displayed, the comparable Index was not available in Morningstar Direct in order to calculate. The data for the indices and the underlying funds of the portfolios is sourced from Morningstar API. We are not responsible for their presence or accuracy. This chart shows the cumulative performance
% of the selected financial assets from the starting point.
Over the 10-year period, the ESG Tracker’s equity performance has remained strong, delivering returns of 231.74% and outperforming both RPI and its peer group. In the fixed income portion of the portfolios, both peer group and RPI have outperformed the ESG Tracker 0 due to periods of high inflation and the higher equity weighting of peer group counterparts. Against the composite index comparator, the 0 model closely tracked but slightly underperformed.
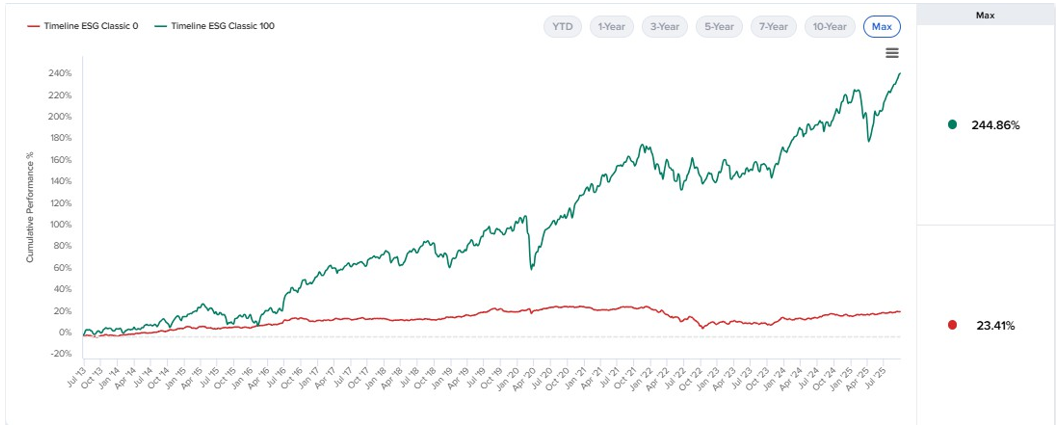
Timeline ESG Classic
The Timeline ESG Classic portfolios are designed to incorporate ESG characteristics into portfolio investment while also capturing the small-cap and value premiums over long investment horizons. The equity-only ESG Classic 100 portfolio delivered a similar return to its non-ESG counterpart, achieving 9.99% growth over the quarter. The ESG Classic 0 portfolio, subject to the same bond market conditions, also experienced a calm quarter in line with the other core ranges, returning 0.71%
© Timeline Holdings Ltd 2025: All data is up to the latest available price. Past performance is no guarantee of future return. The data is sourced from Morningstar API, for which we are not responsible. Where Morningstar may have missing data or inaccurate data, we are not responsible. Careful consideration has been taken to ensure that the information is correct but it neither warrants, represents nor guarantees the contents of the information, nor does it accept any responsibility for errors, inaccuracies, omissions or any inconsistencies herein. Percentages may not total 100 due to rounding.
Performance figures are net of fund manager charges. This tracking error is calculated by Morningstar over a 10-year period and then annualised. Where tracking error is not displayed, the comparable index was not available in Morningstar Direct in order to calculate. The data for the indices and the underlying funds of the portfolios is sourced from Morningstar API. We are not responsible for their presence or accuracy. This chart shows the cumulative performance
% of the selected financial assets from the starting point.
Over the longer term, the portfolios have held up well against their comparators. The 10-year performance is notable, with the ESG Classic 100 portfolio returning 206.81%, significantly outpacing RPI +4% as well as peer group comparators, although it underperformed the composite index comparator. On the fixed income side, similar to other core ranges, Classic ESG 0 struggled against RPI over the longer term but remained in line with the composite portfolio and other peers.
Conclusion
Halloween is approaching, and we hope all our clients have a few treats in store, rather than any nasty tricks. As an early treat, Timeline was pleased to see in SPIVA’s most recent scorecard, which reviewed all active funds against their benchmark data and provided us with a pleasant surprise this quarter. When assessing how many funds underperformed their benchmark, they took the analysis one step further by reviewing the effect of fees. As our readers might expect, this had a big impact. While 75% of active equity mutual funds underperformed the benchmark over 10 years, this figure jumped to 87% once fees were taken into account. This phenomenon was even more pronounced on the fixed income side, with the jump from 38% to 72% underperforming once fees were included.

Source: S&P Dow Jones Indices LLC, eVestment Alliance, CRSP. Data as of Dec. 31, 2024. Based on fund aggregate total underperformance rates across all reported categories. SMA stands for separately managed account. As funds can be included in more than one category, underperformance rates for the most-narrow categories were used. Past performance is no guarantee of future results. Chart is provided for illustrative purposes.24
Timeline does not want to condemn active investing; in fact, it plays a pivotal role in ensuring markets remain highly efficient by transmitting essential information to market participants.
However, these results make two points clear: a) markets are incredibly efficient and difficult to beat, and b) when push comes to shove, costs play a decisive role in performance. Both points are central to Timeline’s philosophy, and we are grateful for the continued support of our advisers and clients on this journey.

 Production